
GeoScore: the location index for Uzbekistan
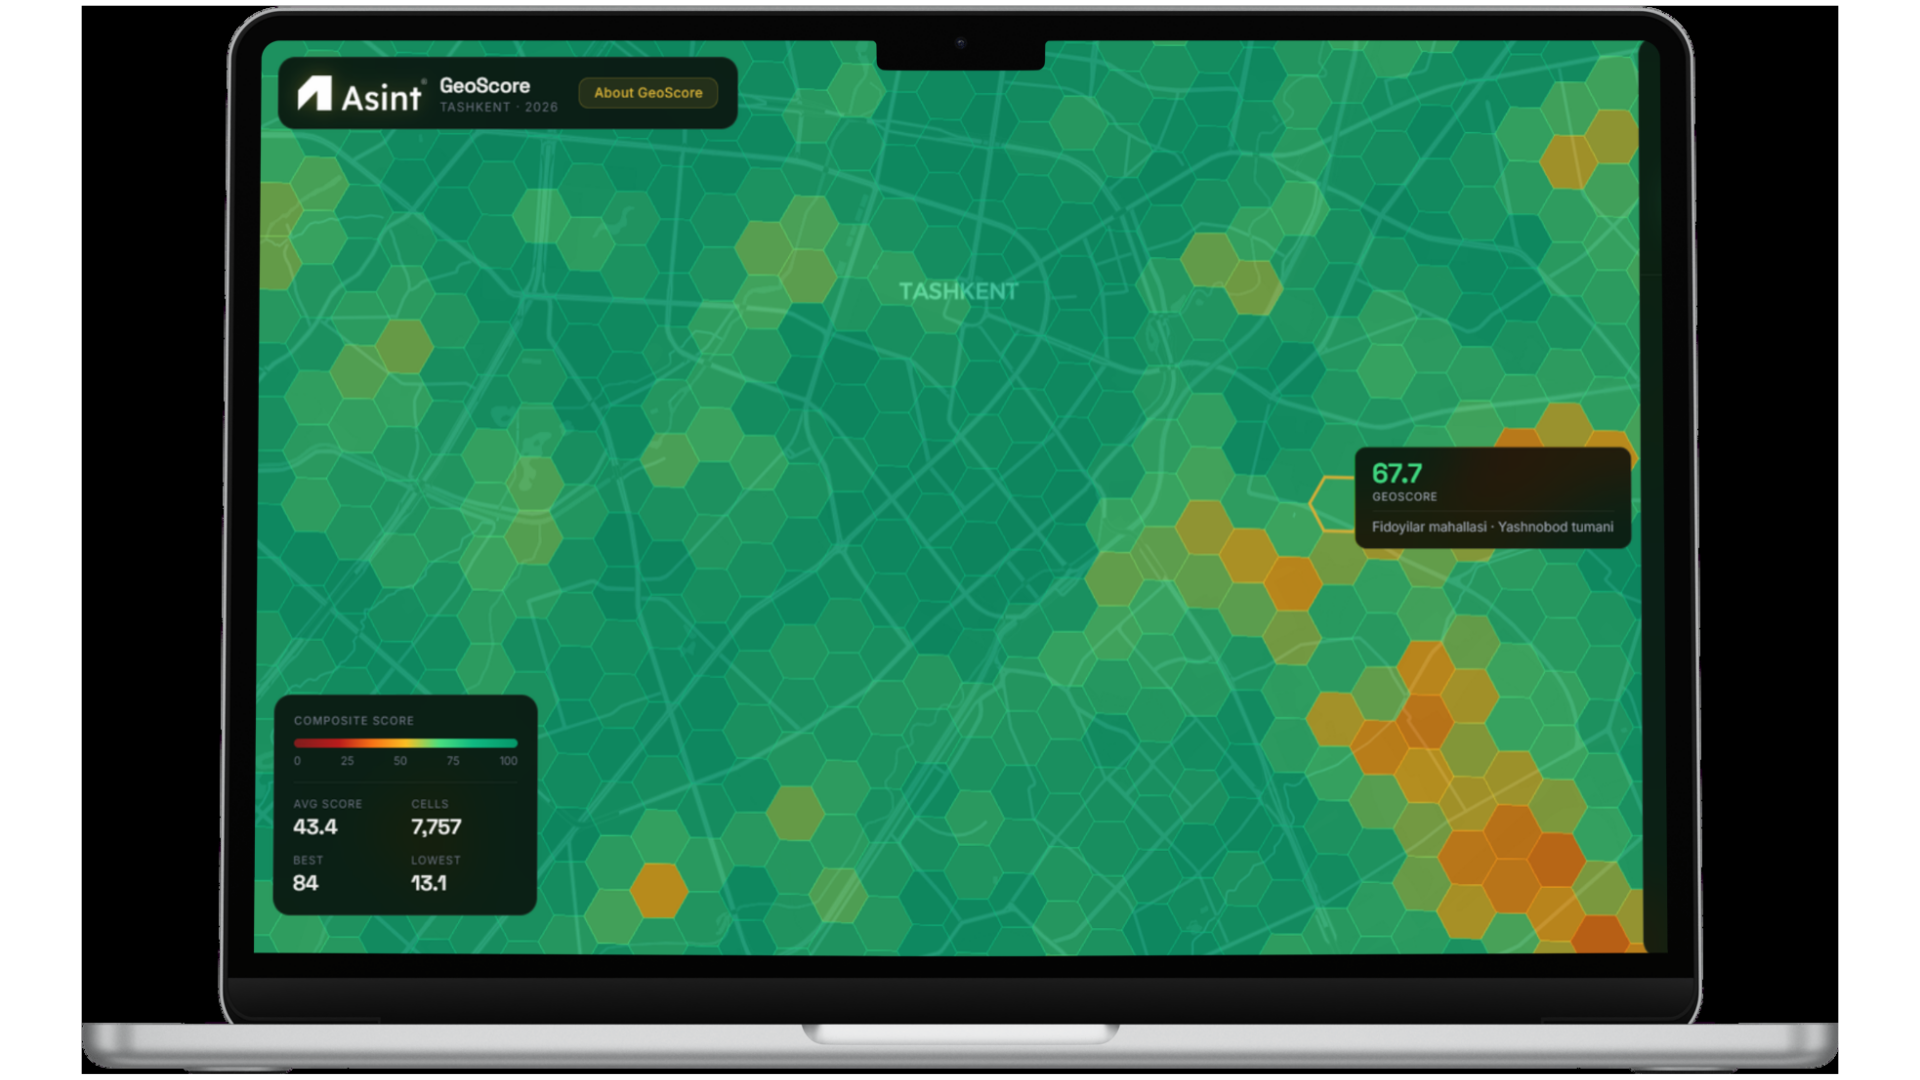
3 axes · 9 subindexes · scores 0–100 on a hexagonal H3 grid. National coverage: 14 regions, 206 districts, 9,431 mahallas.
Three axes, nine subindexes
The axes exist not for symmetry but because different groups take different aggregation operators. Opportunity and quality of place are compensatory, penalised for imbalance. Risk is non-compensatory: it is applied as a multiplier rather than averaged in.
Axis I · Opportunity
What is available to me here?
positionPosition & regional access
How connected is this place to the country's settlement system?
mobilityMobility & transport
How easily can you move from here?
servicesServices & amenities
Can daily life be run from this address?
economyEconomic base & employment
Does this place work, or is it a dormitory?
Axis II · Quality of place
What is it like to live here?
environmentEnvironment & sanitary quality
What is the air, the noise, the greenery?
builtBuilt & housing environment
What is built here, in what condition, how well serviced?
communitySocial environment & safety
Who lives here, and how safe is it?
Axis III · Risk
What can go wrong?
hazard_natNatural hazards
What threatens from nature?
hazard_techTechnogenic & sanitary protection risks
What threatens from human activity?
Risk is not averaged in with amenities. A place in a dam-breach zone does not get better because there is a school nearby.
Why 50 is the norm, not the middle
For every indicator, the 0 and 100 points come from a source outside the project — Uzbekistan's urban planning norms (ShNQ), sanitary norms (SanEpid), WHO guidelines, the 3-30-300 rule, the DEGURBA classification, World Bank seismic hazard maps. Percentiles are forbidden in the main index.
What this changes in practice
"Jizzakh 34, Tashkent 80" does not read as "Jizzakh is in the bottom third". It reads as "the average location in Jizzakh falls short of the norm; the average location in Tashkent exceeds it".
Design principles, indicator admission rules, the aggregation scheme and the open questions — in a separate document.
Full methodology →What GeoScore deliberately excludes
Price. GeoScore is an input to our valuation models, so putting price inside the index would make it circular.
Plans and dynamics. "Where is this place heading" is a separate momentum index; GeoScore answers "what is it now".
Registry coverage today
The index registry holds 329 indicators, and it keeps growing. Below you can see the current picture of the data.
- 22%
- already in the data
- 24%
- we compute ourselves
- 18%
- partially available
- 37%
- statistics and calculations from external sources
Data sources and external anchors
For every indicator, the 0 and 100 points come from a source outside the project — not from the distribution of our own data.
WHO AQG 2021
Air quality guideline — anchor for environmental indicators
WHO ENG 2018
Noise level guideline — anchor for acoustic indicators
3-30-300
Urban greenery rule: a tree from every window, canopy over a third of the block, a park within 300 m
DEGURBA
International settlement-type classification — for context-aware normalisation
ShNQ
Uzbekistan's urban planning norms and rules — service radii for schools, clinics and transit stops
SanEpid
Sanitary protection zones — anchor for technogenic risk
World Bank PGA
Seismic hazard map — anchor for natural risk
Sentinel-2/5P · ESA
Satellite imagery — built form, terrain and vegetation
A worked example (illustrative)
A sample location in Tashkent's Yunusabad district. This illustrates the method — it is not the result of a real API query.
positionPosition & regional access62mobilityMobility & transport74servicesServices & amenities81economyEconomic base & employment58environmentEnvironment & sanitary quality69builtBuilt & housing environment71communitySocial environment & safety65hazard_natNatural hazards88hazard_techTechnogenic & sanitary protection risks92The overall GeoScore is deliberately not shown here: axis and subindex weights are still being calibrated — see the coverage section above.
API response format
GET /v1/geo-score?lat=41.299&lon=69.240

{
  "subindexes": {
    "position":     62,
    "mobility":     74,
    "services":     81,
    "economy":      58,
    "environment":  69,
    "built":        71,
    "community":    65,
    "hazard_nat":   88,
    "hazard_tech":  92
  },
  "confidence": "HIGH"
}
Frequently asked questions
How is GeoScore calculated?
Every indicator is normalised against an external anchor — a WHO guideline, a building code, a physical limit — rather than the distribution of our own data. Indicators roll up into subindexes, subindexes roll up into one of three axes, and risk is applied as a multiplier rather than averaged in with the rest.
Why is 50 the norm, not the middle?
An ordinary rating is a percentile: the score moves when other places move. We anchored the scale to external norms instead: 50 means the national norm is met. A place does not get worse because a new school was built in a different city.
How is GeoScore different from WalkScore?
WalkScore is, in essence, a single pedestrian-amenity-access score calibrated on American cities. GeoScore is three axes and nine subindexes for Uzbekistan — opportunity, quality of place and risk — with risk applied as a multiplier rather than averaged in with amenities.
How does a bank use GeoScore?
A bank might set a rule such as: if the hazard_nat subindex falls below a threshold, require additional insurance or reduce the LTV. GeoScore plugs into credit scoring as an objective, reproducible input — it does not replace the credit committee's decision.